UNIT - 2
PROJECT IDENTIFICATION
Identification of a new project is a complex problem. Project selection process starts with the generation of project ideas. In order to select the most promising project, the entrepreneur needs to generate a few ideas about the possible project one can undertake. The project ideas as a process of identification of a project begins with an analytical survey of the economy (also known as pre-investment surveys). The surveys and studies will give us ideas. The process of project selection consists of following stages :
Idea generation
Environment appraisal.
Corporate appraisal
Scouting for project ideas.
Preliminary screening.
Project rating index
Sources of positive Net Present Value.
Entrepreneur qualities.
Idea Generation :-
Project ideas are generated through different sources like customers, competitors and employees. Sometimes they are discovered through accident. Project manager should try to enhance people’s creativity, scan the entire business environment and appraise the company’s strengths and weaknesses to generate a large number of ideas. Techniques like attribute listing, brainstorming, and delphi technique are useful for improving the creativity at individual and group level.
The project managers should analyze the business environment that consists of the economic sector, the governmental sector, the technological sector, the socio-demographic sector, the competition sector and the supplier sector. Once a pool of ideas has been generated, the projectmanager should carefully screen them. The Project Rating Index method helps managers.
Procedures for Idea Generation
“We need to think differently!”
“This needs some fresh ideas!”
“We have got to be more creative around here!”
Are messages like these popping up more and more in your workplace? Faced with complex,
open-ended, ever-changing challenges, organizations realize that constant, ongoing innovation
is critical to stay ahead of the competition.
This is why we need to be on the lookout for new ideas that can drive innovation, and it’s why the ability to think differently, generate new ideas, and spark creativity within a team becomes an important skill. You need to work actively on building and cultivating this skill, and it can be done!
Often, though, we make the mistake of assuming that good ideas just happen. Or worse still, we get caught in the mind trap that creativity is an aptitude; some people have it, others don’t. Then there is the other self-defeating belief – “I am not intelligent enough to come up with good ideas.”
These assumptions are rarely true. Everyone can come up with fresh, radical ideas – you just need to learn to open your mind and think differently. This article shows you how to do so.
1. How to Generate New Ideas: Standard idea-generation techniques concentrate on combining or adapting existing ideas. This can certainly generate results. But here, our focus is on equipping you with tools that help you leap onto a totally different plane. These approaches push your mind to forge new connections, think differently and consider new perspectives.
A word of caution – while these techniques are extremely effective, they will only succeed if they are backed by rich knowledge of the area you’re working on. This means that if you are not prepared with adequate information about the issue, you are unlikely to come up with a great idea even by using the techniques listed here.
Incidentally, these techniques can be applied to spark creativity in group settings and brainstorming sessions as well.
Breaking Thought Patterns: All of us can tend to get stuck in certain thinking patterns. Breaking these thought patterns can help you get your mind unstuck and generate new ideas. There are several techniques you can use to break established thought patterns:
(a) Challenge assumptions: For every situation, you have a set of key assumptions. Challenging these assumptions gives you a whole new spin on possibilities.
You want to buy a house but can’t since you assume you don’t have the money to make a down payment on the loan. Challenge the assumption. Sure, you don’t have cash in the bank but couldn’t you sell some of your other assets to raise the money? Could you dip into your retirement fund? Could you work overtime and build up the kitty in six months? Suddenly the picture starts looking brighter.
(b) Reword the problem: Stating the problem differently often leads to different ideas. To reword the problem look at the issue from different angles. “Why do we need to solve the problem?”, “What’s the roadblock here?”, “What will happen if we don’t solve the problem?” These questions will give you new insights. You might come up with new ideas to solve your new problem.
In the mid 1950s, shipping companies were losing money on freighters. They decided theyneeded to focus on building faster and more efficient ships. However, the problem persisted. Then one consultant defined the problem differently. He said the problem the industry should consider was “how can we reduce cost?” The new problem statement generated new ideas.All aspects of shipping, including storage of cargo and loading time, were considered. The outcome of this shift in focus resulted in the container ship and the roll-on/roll-off freighter.
(c) Think in reverse: If you feel you cannot think of anything new, try turning things upside-down. Instead of focusing on how you could solve a problem/improve operations/enhance a product, consider how could you create the problem/worsen operations/downgrade the product. The reverse ideas will come flowing in. Consider these ideas – once you’ve reversed them again – as possible solutions for the original challenge.
(d) Express yourself through different media: We have multiple intelligences but somehow, when faced with workplace challenges we just tend to use our verbal reasoning ability. How about expressing the challenge through different media? Clay, music, word association games, paint, there are several ways you can express the challenge. Don’t bother about solving the challenge at this point. Just express it. Different expression might spark off different thought patterns. And these new thought patterns may yield new ideas. Connect the Unconnected: Some of the best ideas seem to occur just by chance. You see something or you hear someone, often totally unconnected to the situation you are trying to resolve, and the penny drops in place. Newton and the apple, Archimedes in the bath tub; examples abound.
Why does this happen? The random element provides a new stimulus and gets our brain cells ticking. You can capitalize on this knowledge by consciously trying to connect the unconnected.
Actively seek stimuli from unexpected places and then see if you can use these stimuli to build a connection with your situation. Some techniques you could use are:
(a) Use random input: Choose a word from the dictionary and look for novel connections between the word and your problem.
(b) Mind map possible ideas: Put a key word or phrase in the middle of the page. Write whatever else comes in your mind on the same page. See if you can make any connections.
(c) Pick up a picture: Consider how you can relate it to your situation.
(d) Take an item: Ask yourself questions such as “How could this item help in addressing the challenge?”, or “What attributes of this item could help us solve our challenge?”
Perspective: Over the years we all build a certain type of perspective and this perspective yields a certain type of idea. If you want different ideas, you will have to shift your perspective. To do so:
(a) Get someone else’s perspective: Ask different people what they would do if faced with your challenge. You could approach friends engaged in different kind of work, your spouse, a nine-year old child, customers, suppliers, senior citizens, someone from a different culture; in essence anyone who might see things differently. (b) Play the “If I were” game: Ask yourself “If I were ...” how would I address this challenge?
You could be anyone: a millionaire, Tiger Woods, anyone. The idea is the person you decide to be has certain identifiable traits. And you have to use these traits to address the challenge. For instance, if you decide to play the millionaire, you might want to bring traits such as flamboyance, big thinking and risk-taking when formulating an idea. If you are Tiger Woods you would focus on
things such as perfection, persistence and execution detail.
5. Employ Enablers: Enablers are activities and actions that assist with, rather than directly provoke, idea generation. They create a positive atmosphere. Some of the enablers that can help you get your creative juices flowing are:
(a) Belief in yourself: Believe that you are creative, believe that ideas will come to you; positive reinforcement helps you perform better.
(b) Creative loafing time: Nap, go for a walk, listen to music, play with your child, take a break from formal idea-generating. Your mind needs the rest, and will often come up with connections precisely when it isn’t trying to make them.
(c) Change of environment: Sometimes changing the setting changes your thought process. Go to a nearby coffee shop instead of the conference room in your office, or hold your discussion while walking together round a local park.
(d) Shutting out distractions: Keep your thinking space both literally and mentally clutter free.
Shut off the Blackberry, close the door, divert your phone calls and then think.
(e) Fun and humor: These are essential ingredients, especially in team settings.:
PROJECT SELECTION PROCESS
An organization might have dozens of prospective projects varying for limited resources.
Business Goals
This requires a selection process that maximizes the efficiency of scarce business resources. When selecting between prospective projects, assess how each project ties to the organisation’s goals and objectives. Base selections on the value each project lends to the organisation’s strategic plans. Review the organisation’s vision statements, mission statements and business goals against each project’s objectives.
Selection Criteria
The process of evaluating individual projects or groups of projects for the purpose of choosing which to implement might include a number of factors. When selecting among competing project alternatives, additional project factors that might be reviewed and compared include costs, benefits and risks. While the exact parameters of these factors might not be known with certainty, estimates can be compared to evaluate differences.
Objectives Matrix
Top management might develop a matrix of objectives for projects that are expressly based on the organisation’s business goals and strategies. Examples of objectives include improving the corporate brand with customers, expansion into a new market and growth of market share for a particular product or service, to name a few.
Achievable
A project should be assessed for realism, capability and cost. Thirty percent of all projects end midstream and half of completed projects end an average of 200 percent over schedule and over budget, according to a 2001 study by the Centre for Innovative Management. Unfinished projects are a significant waste of resources. A project that costs more than double its projected budget raises cost-benefit analysis questions.
Notes When selecting between prospective projects, assess how each project ties to the organisation’s goals and objectives. Base selections on the value each project lends to the organisation’s strategic plans.
PROJECT SELECTION AND CRITERIA
One of the biggest decisions that any organisation would have to make is related to the projects they would undertake. Once a proposal has been received, there are numerous factors that need to be considered before an organisation decides to take it up.
The most viable option needs to be chosen, keeping in mind the goals and requirements of the organisation. How is it then that you decide whether a project is viable? How to you decide if the project at hand is worth approving? This is where project selection methods come in use. Choosing a project using the right method is therefore of utmost importance. This is what will ultimately define the way the project is to be carried out. But the question then arises as to how you would go about finding the right methodology for your particular organisation. At this instance, you would need careful guidance in the project selection criteria, as a small mistake could be detrimental to your project as a whole, and in the long run, the organisation as well.
Selection Methods
There are various project selection methods practiced by the modern business organisations. These methods have different features and characteristics. Therefore, each selection method is best for different organisations. Although there are many differences between these project selection methods, usually the underlying concepts and principles are the same. Following is an illustration of two of such methods (Benefit Measurement and Constrained Optimisation methods).
Figure 3.1: Benefit Measurement and Constrained Optimization Methods
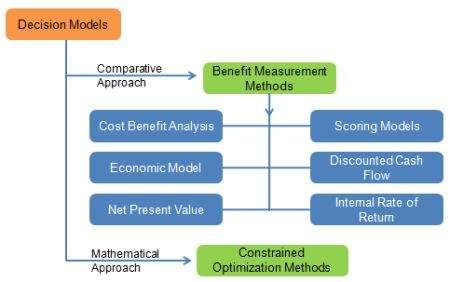
As the value of one project would need to be compared against the other projects, you could use the benefit measurement methods. This could include various techniques, of which the following are the most common:
1. You and your team could come up with certain criteria that you want your ideal project objectives to meet. You could then give each project scores based on how they rate in each of these criteria, and then choose the project with the highest score.
2. When it comes to the Discounted Cash flow method, the future value of a project is ascertained by considering the present value and the interest earned on the money. The higher the present value of the project, the better it would be for your organisation.
3. The rate of return received from the money is what is known as the IRR. Here again, you need to be looking for a high rate of return from the project.
The mathematical approach is commonly used for larger projects. The constrained optimization methods require several calculations in order to decide on whether or not a project should be rejected.
Cost-benefit analysis is used by several organisations to assist them to make their selections. Going by this method, you would have to consider all the positive aspects of the project, which is the benefits, and then deduct the negative aspects (or the costs) from the benefits. Based on the results you receive for different projects, you could choose which option would be the most viable and financially rewarding.
These benefits and costs need to be carefully considered and quantified in order to arrive at a proper conclusion. Questions that you may want to consider asking are in the selection process are:
1. Would this decision help me to increase organisational value in the long run?
2. How long will the equipment last for?
3. Would I be able to cut down on costs as I go along?
In addition to these methods, you could also consider Choosing based on opportunity cost - When choosing any project, you would need to keep in mind the profits that you would make if you do decide to go ahead with the project.
Profit optimisation is therefore the ultimate goal. You need to consider the difference between the profits of the project you are primarily interested in, and the next best alternative.
Implementation of the Chosen Method
The methods mentioned above can be carried out in various combinations. It is best that you try out different methods, as in this way you would be able to make the best decision for your organisation considering a wide range of factors rather than concentrating on just a few. Careful consideration would therefore need to be given to each project.
TYPES OF PROJECT SELECTION MODELS
Of the two basic types of selection models (numeric and non-numeric), non-numeric models are
older and simpler and have only a few subtypes to consider. We examine them first.
Non-Numeric Models
These include the following:
1. The Sacred Cow: In this case the project is suggested by a senior and powerful official in the organisation. Often the project is initiated with a simple comment such as, “If you have a chance, why don’t you look into . . .,” and there follows an undeveloped idea for a new product, for the development of a new market, for the design and adoption of a global database and information system, or for some other project requiring an investment of the firm’s resources. The immediate result of this bland statement is the creation of a “project” to investigate whatever the boss has suggested. The project is “sacred” in the sense that it will be maintained until successfully concluded, or until the boss, personally, recognises the idea as a failure and terminates it.
2. The Operating Necessity: If a flood is threatening the plant, a project to build a protective dike does not require much formal evaluation, which is an example of this scenario. XYZ Steel Corporation has used this criterion (and the following criterion also) in evaluating potential projects. If the project is required in order to keep the system operating, the primary question becomes: Is the system worth saving at the estimated cost of the project? If the answer is yes, project costs will be examined to make sure they are kept as low as is consistent with project success, but the project will be funded.
3. The Competitive Necessity: Using this criterion, XYZ Steel undertook a major plant rebuilding project in the late 1960s in its steel bar manufacturing facilities near Chicago. It had become apparent to XYZ’s management that the company’s bar mill needed modernisation if the firm was to maintain its competitive position in the Chicago market area. Although the planning process for the project was quite sophisticated, the decision to undertake the project was based on a desire to maintain the company’s competitive position in that market. In a similar manner, many business schools are restructuring their undergraduate and Masters in Business Administration (MBA) programs to stay competitive
with the more forward looking schools. In large part, this action is driven by declining numbers of tuition paying students and the need to develop stronger programs to attract them.
Investment in an operating necessity project takes precedence over a competitive necessity project, but both types of projects may bypass the more careful numeric analysis used for projects deemed to be less urgent or less important to the survival of the firm.
4. The Product Line Extension: In this case, a project to develop and distribute new products would be judged on the degree to which it fits the firm’s existing product line, fills a gap, strengthens a weak link, or extends the line in a new, desirable direction. Sometimes careful calculations of profitability are not required. Decision makers can act on their beliefs about what will be the likely impact on the total system performance if the new product is added to the line.
5. Comparative Benefit Model: For this situation, assume that an organisation has many projects to consider, perhaps several dozen. Senior management would like to select a subset of the projects that would most benefit the firm, but the projects do not seem to be easily comparable. For example, some projects concern potential new products, some concern changes in production methods, others concern computerisation of certain records, and still others cover a variety of subjects not easily categorised (e.g., a proposal to create a daycare center for employees with small children).
The organisation has no formal method of selecting projects, but members of the selection committee think that some projects will benefit the firm more than others, even if they have no precise way to define or measure “benefit.” The concept of comparative benefits, if not a formal model, is widely adopted for selection decisions on all sorts of projects. Most United Way organisations use the concept to make decisions about which of several social programs to fund. Senior management of the funding organisation then examines all projects with positive recommendations and attempts to construct a portfolio that best fits the organisation’s aims and its budget.
Numeric Models
Payback period,ARR, Internal Rate of Return (IRR), NPV, PI.
PROJECT RATING INDEX
The Project Definition Rating Index (PDRI) for Building Projects is a powerful and simple tool that helps meet this need by offering a method to measure project scope definition for completeness. It is adapted from the PDRI for Industrial Projects.
The PDRI offers a comprehensive checklist of 64 scope definition elements in an easy-to-use score sheet format. Each element is weighted based on its relative importance to the other elements. Since the PDRI score relates to risk, those areas that need further work can easily be isolated. (A PDRI score of 200 or less has been shown to greatly increase the probability of a successful project.)
The PDRI identifies and precisely describes each critical element in a scope definition package and allows a project team to quickly predict factors impacting project risk. It is intended to evaluate the completeness of scope definition at any point prior to the time a project is considered for development of construction documents and construction. Building type projects may include the following:
1. Offices
2. Schools (classrooms)
3. Banks
4. Research and laboratory facilities
5. Medical facilities
6. Stores and shopping centers
7. Institutional buildings
8. Apartments
9. Dormitories
10. Parking structures
11. Hotels and motels
12. Light assembly and manufacturing
13. Warehouses
14. Airport terminals
15. Recreational and athletic facilities
16. Public assembly and performance halls
STEPS IN PROJECT RATING INDEX
1. Identify factors relevant for project rating.
2. Assign weights to these factors according to importance
3. Rate the project proposal on various factors using a suitable rating scale.
4. For each factor, multiply the factor rating with the factor weight to get the factor score.
5. Add all the factor scores to get the overall project rating index.
BENEFITS OF PDRI
Effective early project planning improves project performance in terms of both cost and schedule. The majority of industry participants recognize the importance of scope definition during the early stages of a project and its potential impact on project success. Until now, however, the building industry has been lacking a practical, non-proprietary method for determining the degree of scope development on a project. The PDRI for buildings is the first publicly available tool of its kind in this sector. It allows a project planning team to quantify, rate, and assess thelevel of scope development on projects prior to beginning development of construction documents.
A significant feature of the PDRI is that it can be utilized to fit the needs of almost any individual
project, small or large. Elements that are not applicable to a specific project can be zeroed out, thus eliminating them from the final scoring calculation.
The PDRI is quick and easy to use. It is a “best practice” tool that will provide numerous benefits
to the building industry. A few of these include:
1. A checklist that a project team can use for determining the necessary steps to follow in
Defining the project scope
2. A listing of standardized scope definition terminology throughout the building industry
3. An industry standard for rating the completeness of the project scope definition package to facilitate risk assessment and prediction of escalation, potential for disputes, etc.
4. A means to monitor progress at various stages during the front end planning effort
5. A tool that aids in communication and promotes alignment between owners and design contractors by highlighting poorly defined areas in a scope definition package
6. A means for project team participants to reconcile differences using a common basis for project evaluation
7. A training tool for organizations and individuals throughout the industry
8. A benchmarking tool for organizations to use in evaluating completion of scope definition versus the performance of past projects, both within their organization and externally, in order to predict the probability of success on future projects.
WHY SHOULD USE THE PDRI?
The PDRI can benefit facility owners such as NASA, as well as designers and constructors. NASA
planners can use it as an assessment tool for establishing a comfort level at which they are willing to move forward with projects. Designers and constructors working with NASA can use it as a method of identifying poorly defined project scope definition elements. The PDRI provides a means for all project participants to communicate and reconcile differences using an objectivetool as a common basis for project scope evaluation.
Note : The front end planning process of a PDRI should consider the following factors:
1. Feasibility
2. Concept
3. Detailed scope
4. Design and construction
MARKET AND DEMAND ANALYSIS TECHNIQUE
Forecast vs. Prediction: Forecast is an estimate of future events and trends and is arrived at by systematically combining past data and projecting it forward in a predetermined manner. Prediction is an estimate of future events and trends in a subjective manner without taking into account the past data. The subjective considerations may not emerge from any predetermined analysis or approach.
Time Horizon of Demand Forecasting: Market and demand analysis of various types are undertaken to meet specific requirements of planning and decision making.
Example: Short-term decisions in production planning, distribution etc. and selling individual products would require short-term forecast, up to one year time horizon, which must he fairly accurate for specific product items. For long-term planning, time horizon being four to five years, information required from demand analysis would be for broad product groups for facilitating choice of technology, machine tools and other hardwares and their location. Longer-term forecasting is also undertaken to determine trends in technology development so as to choose the technology for backing up and funding its research and development.
NEED FOR DEMAND FORECASTING
All business planning starts with forecasting Capital investment, like procurement of raw materials and production planning, has to relate to demand forecasting. High volume high technology mass production systems have further highlighted the importance of accurate demand forecasts. Even in a batch type production, any major mismatch between forecast and manufacture will lead to higher capital tied up in finished products which are slow in selling.
UNCERTAINTIES IN DEMAND FORECASTING
Demand forecasting is the estimate of future demand. As the future is always uncertain, forecasting cannot be completely fool proof and correct. However, the very process of forecasting demand in future involves evaluating various forces and factors which influence demand. This exercise is very rewarding in itself as it enables the personnel to know about various market forces,currents, cross-currents and under-currents relevant to the demand behavior.
LEVELS OF DEMAND FORECASTING NOTES
Demand forecasting can be at the level of a firm or an industry or at the national or national or international level:
1. Firm Level: If the exercise aims at forecasting demand of firms products locally at state, region or national level, it is a micro-level of demand forecasting. Sometimes, forecasts are required for company products in specific industry or market segment.
2. Industry Level: Such a demand forecasting exercise focuses on an industry as a whole for the region and/or national level. These forecasts may be undertaken by a group of companies or by industry/trade associations.
3. National Level: Demand forecasts at national level include parameters like national income, expenditure, index of industrial and/or agricultural production etc. Estimating aggregate demand of products at national level facilitates governmental decisions for imports, exports, pricing policy, etc.
4. International Level: Companies operating in multinational markets would require similar forecasting of demands for its products, trends in consumption, etc. at international level Managerial Economists play a leading role in masterminding these forecasts at firm, industry, national and international levels. Time horizon of these demand forecasts usually varies from 1 to 5 years and in rare instances up to 10 years.
CRITERIA FOR A GOOD FORECASTING METHOD
A good forecasting method should have the following attributes:
1. Accuracy in forecast: Accuracy in forecast is measured in terms of past forecasts against current sales and by the percentage of deviation form actual demand. It is important to not only check the accuracy of past forecasts but also the validity of assumptions in practice.
Forecasts being future-oriented, cannot be always accurate although accuracy is the most important criterion. Plausibility of forecasts: Forecasts of demand must be reasonable, consistent and plausible.
Assumptions made should stand scrutiny and techniques adopted must be commensurate. Explanatory note on these aspects must be available in the write-up on methods and methodology employed in forecasting.
3. Economy of forecasts: Forecasting exercise should not be expensive in terms of efforts and costs. Additional costs of ways and means for improving the accuracy of forecasts should not exceed the extra gain expected.
4. Quick Results: Method of forecasting chosen should be capable of yielding quick and useful results, If method selected takes fat too long a time to yield accurate forecast, it may not be conducive for taking quick and effective decisions. Always remember not to make best enemy of ‘good’.
5. Availability and Timeliness: Methodology of forecasting should be such that it can easily be updated when changes occur in the demand relationships.
6. Durability: Demand forecasts should not be changed frequently. Durability of forecast is subject to the followings:
(a) Simple and reasonable relationship between price and demand, advertisement and sales, level of income and volume of sales etc.
(b) Stability of relationship between the above variables.
7. Flexibility: Flexibility of forecast is an added advantage. It is desirable to be able to adjust ‘coefficient’ of variables from time to time to cope with the changing conditions.
METHODS OF FORECASTING DEMAND
To facilitate proper and reliable appraisal of investment proposal, we require a reasonably accurate forecast of demand. Starting with qualitative methods like survey of collective opinions, buyers’ intention, Delphi approach and its variant, a number of quantitative methods are used for compiling and computing demand forecasts as detailed below:
1. Collective Opinion Survey: Sales personnel are closest to the customers and have an intimate feel of the market. Thus they are most suited to assess consumers’ reaction to company’s products. Herein each salesperson makes an estimate of the expected sales in their respective area, territory, state and/or region, These estimates are collated, reviewed and revised to take into account changes in design/features of products, changes in selling prices, projected advertising and sales promotion campaigns and anticipated changes in competitors: marketing policies covering product, people, price, promotion and place.
Opinions of all managers involved at various levels of sales organisation are also included in the survey. Thus “collective opinion survey forms the basis of market analysis and demand forecasting.
Although this method is simple, direct, first hand and most acceptable, it suffers from following weaknesses:
(a) Estimates are based on personal judgment which may not be free from bias.
(b) Adding together demand estimates of individual salespersons to obtain total demand of the country maybe risky as each person has knowledge about a small portion of market only
(c) Salesperson may not prepare the demand estimates with the requisite seriousness and care Owing to limited experience, usually in their employment, salesperson may not have the requisite knowledge and experience This method may be useful for long-term forecasts. It is also used for new products or new variants of existing products.
2. Survey of Customers Intention: Another method of demand forecasting is to carry out a survey of what consumers prefer and intend to buy. If the product is sold to a few large industrial buyers, survey would involve interviewing them. If it is a consumer durable product, a sample survey is carried out for questioning a few representative consumers about what they are planning or intending to buy. It is neither realistic nor desirable to query all consumers either through direct contact or through printed questionnaire by mail.
These surveys serve useful purpose in establishing relationships between:
(a) demand and price
(b) demand and income of consumers
(c) demand and expenditure on advertisement etc.
This method is preferred when bulk of the sales is to institutions and industrial buyers and only a few of them have to be contacted.
Disadvantages are that customers may not know total requirements; in some cases they are not certain about quantity to be purchased. Besides during shortages there is a tendency to inflate their requirements. Survey method is not useful for households – interviewing them is not only difficult out but also expensive. They are not able to give precise idea about their intentions particularly when alternative products are available in the market.
3. Delphi Method of Demand Forecasting: Delphi method is a group process and aims at achieving a consensus of the members. Herein experts in the field of marketing research and demand forecasting are engaged in analyzing economic conditions carrying out sample surveys of market conducting opinion polls.
Based on the above, demand forecast is worked out in following steps:
(a) Coordinator sends out a set of questions in writing to all the experts co-opted on the panel who are requested to write back a brief prediction.
(b) Written predictions of experts are collated, edited and summarized together by the Coordinator.
(c) Based on the summary, Coordinator designs a new set of questions and gives them to the same experts who answer back again in writing.
(d) Coordinator repeats the process of collating, editing and summarizing the responses.
(e) Steps 3 and 4 are repeated by the Coordinator to experts with diverse backgrounds until consensus is reached.
If there is divergence of opinions and hence conclusions, Coordinator has to sort it out through mutual discussions. Coordinator has to have the necessary experience and background as he plays a key role in designing structured questionnaires and synthesizing the data.
Direct interaction among experts is avoided nor their identify is disclosed. Procedure also avoids inter-personnel conflicts nor strong-willed experts are able to dominate the group.
TREND PROJECTION METHOD
Trend projection or least square method is the classical method of business forecasting. In this method, a large amount of reliable data is required for forecasting demand. In addition, this method assumes that the factors, such as sales and demand, responsible for past trends would remain the same in future.
In this method, sales forecasts are made through analysis of past data taken from previous year’s books of accounts. In case of new organizations, sales data is taken from organizations already existing in the same industry. This method uses time-series data on sales for forecasting the demand of a product.
Table-1 shows the time-series data of XYZ Organization:


The trend projection method undertakes three more methods in account, which are as follows:
i. Graphical Method:
Helps in forecasting the future sales of an organization with the help of a graph. The sales data is plotted on a graph and a line is drawn on plotted points.
Let us learn this through a graph shown in Figure-13:

Figure-13 shows a curve which is plotted by taking into the account the sales data of XYZ Organization (Table-1). Line P is drawn through mid-points of the curve and S is a straight line. These lines are extended to get the future sales for year 2010 which is approximately 47 tons. This method is very simple and less expensive; however, the projections made by this method may be based on the personal bias of the forecaster.
ii. Fitting Trend Method:
Implies a least square method in which a trend line (curve) is fitted to the time-series data of sales with the help of statistical techniques.
PROJECT RISK
Risk is inevitable in a business organization when undertaking projects. However, the project manager needs to ensure that risks are kept to a minimal. Risks can be mainly divided between two types, negative impact risk and positive impact risk.
Not all the time would project managers be facing negative impact risks as there are positive impact risks too. Once the risk has been identified, project managers need to come up with a mitigation plan or any other solution to counter attack the risk.
PROJECT RISK MANAGEMENT
Managers can plan their strategy based on four steps of risk management which prevails in an organization. Following are the steps to manage risks effectively in an organization:
Risk Identification
Risk Quantification
Risk Response
Risk Monitoring and Control
Let's go through each of the step in project risk management:
RISK IDENTIFICATION
Managers face many difficulties when it comes to identifying and naming the risks that occur when undertaking projects. These risks could be resolved through structured or unstructured brainstorming or strategies. It's important to understand that risks pertaining to the project can only be handled by the project manager and other stakeholders of the project.
Risks, such as operational or business risks will be handled by the relevant teams. The risks that often impact a project are supplier risk, resource risk and budget risk. Supplier risk would refer to risks that can occur in case the supplier is not meeting the timeline to supply the resources required.
Resource risk occurs when the human resource used in the project is not enough or not skilled enough. Budget risk would refer to risks that can occur if the costs are more than what was budgeted.
RISK QUANTIFICATION
Risks can be evaluated based on quantity. Project managers need to analyze the likely chances of a risk occurring with the help of a matrix.
Using the matrix, the project manager can categorize the risk into four categories as Low, Medium, High and Critical. The probability of occurrence and the impact on the project are the two parameters used for placing the risk in the matrix categories. As an example, if a risk occurrence is low (probability = 2) and it has the highest impact (impact = 4), the risk can be categorized as 'High'.
RISK RESPONSE
When it comes to risk management, it depends on the project manager to choose strategies that will reduce the risk to minimal. Project managers can choose between the four risk response strategies, which are outlined below.
Risks can be avoided
Pass on the risk
Take corrective measures to reduce the impact of risks
Acknowledge the risk
RISK MONITORING AND CONTROL
Risks can be monitored on a continuous basis to check if any change is made. New risks can be identified through the constant monitoring and assessing mechanisms.
Risk Management Process
Following are the considerations when it comes to risk management process:
Each person involved in the process of planning needs to identify and understand the risks pertaining to the project.
Once the team members have given their list of risks, the risks should be consolidated to a single list in order to remove the duplications.
Assessing the probability and impact of the risks involved with the help of a matrix.
Split the team into subgroups where each group will identify the triggers that lead to project risks.
The teams need to come up with a contingency plan whereby to strategically eliminate the risks involved or identified.
Plan the risk management process. Each person involved in the project is assigned a risk in which he/she looks out for any triggers and then finds a suitable solution for it.
RISK REGISTER
Often project managers will compile a document, which outlines the risks involved and the strategies in place. This document is vital as it provides a huge deal of information.
Risk register will often consist of diagrams to aid the reader as to the types of risks that are dealt by the organization and the course of action taken. The risk register should be freely accessible for all the members of the project team.
PROJECT RISK; AN OPPORTUNITY OR A THREAT?
As mentioned above, risks contain two sides. It can be either viewed as a negative element or a positive element. Negative risks can be detrimental factors that can haphazard situations for a project.
Therefore, these should be curbed once identified. On the other hand, positive risks can bring about acknowledgements from both the customer and the management. All the risks need to be addressed by the project manager.
An organization will not be able to fully eliminate or eradicate risks. Every project engagement will have its own set of risks to be dealt with. A certain degree of risk will be involved when undertaking a project.
The risk management process should not be compromised at any point, if ignored can lead to detrimental effects. The entire management team of the organization should be aware of the project risk management methodologies and techniques.
Enhanced education and frequent risk assessments are the best way to minimize the damage from risks.
PROJECT RISK ANALYSIS
Analysis of Risk
Risk analysis is one of the most complex and slippery aspects of capital budgeting. Many different techniques have been suggested and no singe technique can be deemed as best in all situations.
Sources of Risk
Project-specific risk: The earnings and cash flows of the project may be lower than expected because of estimation error or due to some other factors specific to the project like the quality of mgt.
Competitive risk: The earnings and cash flows of the project may be affected by unanticipated actions of the competitors.
Industry specific risk: Unexpected technological developments and regulatory changes, that are specific to the industry to which the project belongs, will have an impact on the earnings and cash flows of the project as well.
Market risk: Unanticipated changes in macroeconomic factors like the GDP growth rate,
Interest rate and inflation have an impact on all projects.
International risk: In the case of a foreign project, the earnings and cash flows may be different than expected due to the exchange rate risk or political risk
Sensitivity Analysis
Sometimes called ’What if’ analysis
•One variable is varied at a time.
•Example: “what will happen to NPV if sales are only 50,000 units rather than the expected 75,000 units?”
Procedure
• Setup the relationship between the basic underlying factors (quantity sold or unit selling price) and NPV.
• Estimate the Range of variation and the most likely value of each of the basic underlying factors.
• Study the effect on net present value of variations in the basic variables.
Merits of Sensitivity analysis
• It forces mgt% to identify the underlying variables and their inter relationships.
• It shows how robust a project is to changes in the underlying variables.
• It indicates the need for further work.
Limitations:
• Avoiding risk characteristics.
• Having one factor variation and keeping balance factor to be constant is difficult task.
Scenario Analysis
In sensitivity analysis, typically one variable is varied at a time. If variable are inter-related as they are most likely to be, it is helpful to look at some plausible scenarios, each scenario representing a consistent combination of variables.
Projected may be evaluated under three different scenarios
• Normal Scenario. {Avg demand, Avg S.P.}
• Optimistic Scenario. {High DD, High S.P. but low V.C.}
• Pessimistic Scenario. {Low DD, Low S.P. but high V.C.}
For Example:
• The base case scenario where the demand and price are expected to be normal.
• The scenario where the demand is high but the price low.
The scenario where the demand is low but the price high.
MONTE CARLO SIMULATION
It will be used for developing the probability profile of a criterion of merit by randomly combining values of variables which have a bearing on the chosen criterion.
Procedure
• Model of the project.
• Specify the values of parameters and the probability distributions of the exogenous variables.
Select a value, at random, from the probability distributions of each of the exogenous
Variables.
• Determine the NPV corresponding to the randomly generated values of exogenous variables and pre specified parameter values.
• Repeat steps 3 and 4 a number of times to get a large number of simulated NPV. Plot the frequency distribution of the NPV.
Decision Tree Analysis
Steps in Decision Tree Analysis:
• Identifying the problem and alternatives.
• Delineating the decision tree.
• Specifying probabilities and monetary outcomes.
• Evaluating various decision alternatives.
Selection of a Project
• Risk profile method.
• Certainty equivalent method.
• Risk adjusted discount rate method.
Risk Analysis in Practice
• Conservative estimation of revenues.
• Safety margin in cost figures.
• Flexible Investment Yardsticks.
• Acceptable overall certainty index.
• Judgment on three point estimates.
• Room for improvement.
Special decision situations:-
• Choice between mutually exclusive projects of unequal life.
Optimal timing decision.
• Determination of economic life.
• Interrelationship between investment and financing aspects.
• Inflation and capital budgeting.
Choice between mutually exclusive projects of unequal life
• Based on cost. {Specifically to the operating cost.}
• Based on life of the asset.
• Based on replacement cost and period.
Optimal timing decision
• Certain conditions – easy to invest.
• Uncertainty conditions – minimize the possibility of an investor and risk will be higher as a result return will also be high.
Determination of economic life
• The economic life of an asset refers to the number of years the asset should be used to produce a certain output.
It has been influenced by:-
• Operating and maintenance cost.
• Capital cost.
Interrelationship between investment and financing aspects
• Adjusted NPV.
• Adjusted Cost of Capital. {Equity and Debt}
Inflation and capital budgeting
• Inflation has been a persistent feature of the Indian economy. Hence it should be properly considered in capital investment appraisal.
• The adjustment for inflation in project appraisal should be made properly
Analysis of Firm and Market Risk:-
• Portfolio theory and capital budgeting.
• Capital asset pricing model.
• Estimation of key factors.
• CAPM and Capital Budgeting.


No comments:
Post a Comment