UNIT - 4
PROJECT SCHEDULING AND NETWORK ANALYSIS
Project Scheduling
Project scheduling is a mechanism to communicate what tasks need to get done and which organizational resources will be allocated to complete those tasks in what timeframe. A project schedule is a document collecting all the work needed to deliver the project on time.
But when it comes to creating a project schedule, well, that’s something few have deep experience with.What and who is being scheduled, and for what purposes, and where is this scheduling taking place, anyway?
A project is made up of many tasks, and each task is given a start and end (or due date), so it can be completed on time. Likewise, people have different schedules, and their availability and vacation or leave dates need to be documented in order to successfully plan those tasks.
Whereas people in the past might have printed calendars on a shared wall in the water-cooler room, or shared spreadsheets via email, today most teams use online project scheduling tools. Typically, project scheduling is just one feature within a larger project management software solution, and there are many different places in the software where scheduling takes place.
For example, most tools have task lists, which enable the manager to schedule multiple tasks, their due dates, sometimes the planned effort against that task, and then assign that task to a person. The software might also have resource scheduling, basically the ability to schedule the team’s availability, but also the availability of non-human resources like machines or buildings or meeting rooms.
Because projects have so many moving parts, and are frequently changing, project scheduling software automatically updates tasks that are dependent on one another, when one scheduled task is not completed on time. It also generates automated email alerts, so team members know when their scheduled tasks are due or overdue, and to let the manager know when someone’s availability has changed.
Project scheduling is simple when managed online, thankfully, especially since the software does all the hard part for you!
How to Schedule a Project
Before going deeper into project scheduling, let’s review the fundamentals to project scheduling. Project scheduling occurs during the planning phase of the project. You have to ask yourself three questions to start:
1. What needs to be done?
2. When will it be done?
3. Who will do it?
Once you’ve got answers to these questions, then you can begin to plan dates, link activities, set the duration, milestones and resources. The following are the steps needed to schedule a project:
Define Activities
What are the activities that you have to do in the project? By using a Work Breakdown Structure (WBS) and a deliverables diagram, you can begin to take these activities and organize them by mapping out the tasks necessary to complete them in an order than makes sense.
Do Estimates
Now that you have the activities defined and broken down into tasks, you next have to determine the time and effort it will take to complete them. This is an essential piece of the equation in order to calculate the correct schedule.
Determine Dependencies
Tasks are not an island, and often one cannot be started until the other is completed. That’s called a task dependency, and your schedule is going to have to reflect these linked tasks. One way to do this is by putting a bit of slack in your schedule to accommodate these related tasks.
Assign Resources
The last step to finalizing your planned schedule is to decide on what resources you are going to need to get those tasks done on time. You’re going to have to assemble a team, and their time will need to be scheduled just like the tasks.
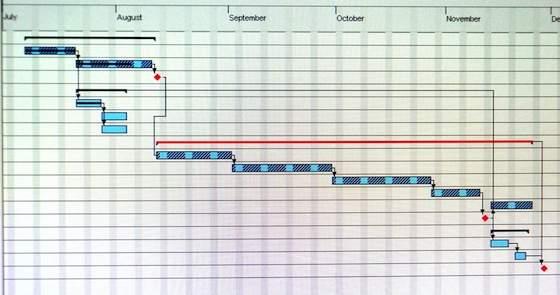
GANTT CHART
Gantt chart is a type of a bar chart that is used for illustrating project schedules. Gantt charts can be used in any projects that involve effort, resources, milestones and deliveries.
At present, Gantt charts have become the popular choice of project managers in every field.
Gantt charts allow project managers to track the progress of the entire project. Through Gantt charts, the project manager can keep a track of the individual tasks as well as of the overall project progression.
In addition to tracking the progression of the tasks, Gantt charts can also be used for tracking the utilization of the resources in the project. These resources can be human resources as well as materials used.
Gantt chart was invented by a mechanical engineer named Henry Gantt in 1910. Since the invention, Gantt chart has come a long way. By today, it takes different forms from simple paper based charts to sophisticated software packages.
The Use
As we have already discussed, Gantt charts are used for project management purposes. In order to use Gantt charts in a project, there are a few initial requirements fulfilled by the project.
First of all, the project should have a sufficiently detailed Work Breakdown Structure (WBS).
Secondly, the project should have identified its milestones and deliveries.
In some instances, project managers try to define the work break down structure while creating Gantt chart. This is one of the frequently practised errors in using Gantt charts. Gantt charts are not designed to assist WBS process; rather Gantt charts are for task progress tracking.
Gantt charts can be successfully used in projects of any scale. When using Gantt charts for large projects, there can be an increased complexity when tracking the tasks.
This problem of complexity can be successfully overcome by using computer software packages designed for offering Gantt chart functionalities.
Tools Available
There are dozens of Gantt chart tools that can be used for successful project tracking. These tools usually vary by the feature offered.
The simplest kind of Gantt chart can be created using a software tool such as Microsoft Excel. For that matter, any spreadsheet tool can be used to design a Gantt chart template.
If the project is small scale and does not involve many parallel tasks, a spreadsheet based Gantt chart can be the most effective type.
Microsoft Project is one of the key Gantt chart tools used today. Especially for software development projects, MS Project based Gantt charts are essential to track the hundreds of parallel tasks involved in the software development life cycle.
There are many other Gantt chart tools available for free and for price. The features offered by these tools range from the same features offered by Excel based Gantt charts to MS Project Gantt charts. These tools come with different price tags and feature levels, so one can select the suitable Gantt chart tool for the purpose in hand.
Creating Your Own
Sometimes, one may decide to create their own Gantt chart tool without buying an existing one. If this is the case, first of all, one should search the Internet for free Gantt chart templates.
This way, one may actually find the exact Gantt chart template (probably in Excel) required for the purpose. In case, if no match is found, then it is sensible to create one's own.
Excel is the most popular tool for creating custom Gantt charts. Of course, one can create a Gantt chart from scratch in Excel, but it is always advisable to use a Project Management add-on in Excel to create Gantt charts.
These project management add-ons are published by Microsoft and other third-party companies.
Advantages & Disadvantages
The ability to grasp the overall status of a project and its tasks at once is the key advantage in using a Gantt chart tool. Therefore, upper management or the sponsors of the project can make informed decisions just by looking at the Gantt chart tool.
The software-based Gantt charts are able to show the task dependencies in a project schedule. This helps to identify and maintain the critical path of a project schedule.
Gantt chart tools can be used as the single entity for managing small projects. For small projects, no other documentation may be required; but for large projects, the Gantt chart tool should be supported by other means of documentation.
For large projects, the information displayed in Gantt charts may not be sufficient for decision making.
Although Gantt charts accurately represent the cost, time and scope aspects of a project, it does not elaborate on the project size or size of the work elements. Therefore, the magnitude of constraints and issues can be easily misunderstood.
Conclusion
Gantt chart tools make project manager's life easy. Therefore, Gantt chart tools are important for successful project execution.
Identifying the level of detail required in the project schedule is the key when selecting a suitable Gantt chart tool for the project.
One should not overly complicate the project schedules by using Gantt charts to manage the simplest tasks.
WORK BREAKDOWN STRUCTURE (WBS).
Dividing complex projects to simpler and manageable tasks is the process identified as Usually, the project managers use this method for simplifying the project execution. In WBS, much larger tasks are broken down to manageable chunks of work. These chunks can be easily supervised and estimated.
WBS is not restricted to a specific field when it comes to application. This methodology can be used for any type of project management.
Following are a few reasons for creating a WBS in a project:
Accurate and readable project organization.
Accurate assignment of responsibilities to the project team.
Indicates the project milestones and control points.
Helps to estimate the cost, time and risk.
Illustrate the project scope, so the stakeholders can have a better understanding of the same.
Construction of a WBS
Identifying the main deliverables of a project is the starting point for deriving a work breakdown structure.
This important step is usually done by the project managers and the subject matter experts (SMEs) involved in the project. Once this step is completed, the subject matter experts start breaking down the high-level tasks into smaller chunks of work.
In the process of breaking down the tasks, one can break them down into different levels of detail. One can detail a high-level task into ten sub-tasks while another can detail the same high-level task into 20 sub-tasks.
Therefore, there is no hard and fast rule on how you should breakdown a task in WBS. Rather, the level of breakdown is a matter of the project type and the management style followed for the project.
In general, there are a few "rules" used for determining the smallest task chunk. In "two weeks" rule, nothing is broken down smaller than two weeks worth of work.
This means, the smallest task of the WBS is at least two-week long. 8/80 is another rule used when creating a WBS. This rule implies that no task should be smaller than 8 hours of work and should not be larger than 80 hours of work.
One can use many forms to display their WBS. Some use tree structure to illustrate the WBS, while others use lists and tables. Outlining is one of the easiest ways of representing a WBS.
Following example is an outlined WBS:

There are many design goals for WBS. Some important goals are as follows:
Giving visibility to important work efforts.
Giving visibility to risky work efforts.
Illustrate the correlation between the activities and deliverables.
Show clear ownership by task leaders.
WBS Diagram
In a WBS diagram, the project scope is graphically expressed. Usually the diagram starts with a graphic object or a box at the top, which represents the entire project. Then, there are sub-components under the box.
These boxes represent the deliverables of the project. Under each deliverable, there are sub-elements listed. These sub-elements are the activities that should be performed in order to achieve the deliverables.
Although most of the WBS diagrams are designed based on the deliveries, some WBS are created based on the project phases. Usually, information technology projects are perfectly fit into WBS model.
Therefore, almost all information technology projects make use of WBS.
In addition to the general use of WBS, there is specific objective for deriving a WBS as well. WBS is the input for Gantt charts, a tool that is used for project management purpose.
Gantt chart is used for tracking the progression of the tasks derived by WBS.
Following is a sample WBS diagram:

Conclusion
The efficiency of a work breakdown structure can determine the success of a project.
The WBS provides the foundation for all project management work, including, planning, cost and effort estimation, resource allocation, and scheduling.
Therefore, one should take creating WBS as a critical step in the process of project management.
RACI
RACI denotes Responsible, Accountable, Consulted and Informed, which are four parameters used in a matrix used in decision making. RACI chart tool outlines the activities undertaken within an organization to that of the people or roles.
In an organization, people can be allocated or assigned to specific roles for which they are responsible, accountable, consulted or informed.
RACI chart tool is a great tool when it comes to identifying employee roles within an organization. This tool can be successfully used when there is role confusion within the company. Role confusion may lead to unproductive work culture.
Parameters in RACI Chart Tool
RACI chart tool represents four parameters as we have already noted in the Introduction. Following are the meanings for each of these parameters:
Responsible: This is a person, who performs a task or work and he/she is responsible for the work.
Accountable: Primarily the person in charge of the task or work.
Consulted: Person, who gives feedback, contribute as and when required.
Informed: Person in charge who needs to know the action or decision taken.
A sample RACI tool

Benefits of a RACI Chart Tool
Following are the well-noted benefits of this tool for the business organizations:
Identifying the workload that have been assigned to specific employees or departments
Making sure that the processes are not overlooked
Ensuring that new recruits are explained of their roles and responsibilities
Finding the right balance between the line and project responsibilities
Redistributing work between groups to get the work done faster
Open to resolving conflicts and discussions
Documenting the roles and responsibilities of the people within the organization
How is RACI Chart Tool Used?
Identifying key functions and processes within an organization is the first step towards using the RACI chart tool. Then, the organization needs to outline the activities that take place and should avoid any miscellaneous activities.
Following are the detailed steps for using RACI chart tool:
Explain each activity that had taken place.
Create phrases to indicate the result of the decision made.
Decisions and activities need to be applied to the role rather than targeting the person.
Create a matrix, which represents the roles and activities and enter the RACI Code created.
Once all the relevant data have been collated and input onto the RACI chart tool, any discrepancies need to be resolved.
Changing Management Issues
The primary reason for creating a RACI chart tool is to resolve organizational issues. It looks at three main factors:
Role conception: The attitude or thinking of people towards their work roles
Role expectation: The expectation of a person with regards to another person's job role.
Role behavior: The activities of people in their job function.
These three concepts help management to identify the misconceptions that people have towards their job roles.
Reasons for Role Confusion
Although role confusion can be solved using RACI chart tool, it is always a good idea to identify the reasons behind such confusion. This helps the organization to avoid such situations occurring in the future.
Following are some of the reasons for role confusion:
Improper balance of work
Idle time
Passing on the ball, being irresponsible
Confused as to who makes the decisions
Ineffective communications
De-motivation
Filling idle time by creating and attending to non-essential time
Don't care since no one's bothered attitude
When to Use RACI Chart Tool?
RACI chart tool can be successfully used under the following conditions.
For employees to get a clear understanding of the role and responsibilities around the work process.
To improve the understanding of function between departments and responsibilities within one's department.
To clearly define the roles and responsibilities of team members, who are working on a project.
Steps Taken When Designing RACI Chart Tool
The first step towards designing RACI chart tool is that the management needs to identify the process or function that faces issues. The process or feature needs to be thoroughly investigated in terms of its requirements and objectives.
The roles or job functions need to be identified in terms as to which ones will be impacted and who will be implementing the changes.
The roles to be created will have its owner. The management needs to assign a role to each individual.
Identify who has an R role (responsible) and then it needs to be listed in terms of A, C and I. RACI chart tools do not work in a way that two people will be held responsible (R) for the same thing.
Review needs to be conducted so that there are no duplicates in the process.
Conclusion
RACI chart tool is a useful and effective decision making tool that helps to define roles and responsibilities. This is used to identify inefficiencies of organizational roles.
It helps to resolve any functional issues that arise within departments or between individuals.
The main objective of RACI chart tool is to eliminate role confusions and to be able to deliver the product or service successfully to the customer and contribute to the long-term organizational objectives.
Introduction to PERT and CPM
The two most common and widely used project management techniques that can be classified under the title of Network Analysis are Programme Evaluation and review Technique (PERT) and Critical Path Method (CPM). Both were developed in the 1950's to help managers schedule, monitor and control large and complex projects. CPM was first used in 1957 to assist in the development and building of chemical plants within the DuPont corporation. Independently developed, PERT was introduced in 1958 following research within the Special Projects Office of the US Navy. It was initially used to plan and control the Polaris missile programme which involved the coordination of thousands of contractors. The use of PERT in this case was reported to have cut eighteen months off the overall time to completion.
The PERT/CPM Procedure
There are six stages common to both PERT and CPM:
1. Define the project and specify all activities or tasks.
2. Develop the relationships amongst activities. Decide upon precedences.
3. Draw network to connect all activities.
4. Assign time and/or costs to each activity.
5. Calculate the longest time path through the network: this is the "critical path".
6. Use network to plan, monitor and control the project.
Finding the critical path (step 5) is a major in controlling a project. Activities on the critical path represent tasks which, if performed behind schedule, will delay the whole project. Managers can derive flexibility by identifying the non-critical activities and replanning, rescheduling and reallocating resources such as manpower and finances within identified boundaries.
PERT and CPM differ slightly in their terminology and in network construction. However their objectives are the same and, furthermore, their project analysis techniques are very similar. The major difference is that PERT employs three time estimates for each activity. Probabilities are attached to each of these times which, in turn, is used for computing expected values and potential variations for activity times. CPM, on the other hand, assumes activity times are known and fixed, so only one time estimate is given and used for each activity. Given the similarities between PERT and CPM, their methods will be discussed together. The student will then be able to use either, deciding whether to employ variable (PERT) or fixed (CPM) time estimates within the network.
PERT and CPM can help to answer the following questions for projects with thousands of activities and events, both at the beginning of the project and once it is underway:
When will the project be completed?
What are the critical activities (i.e.: the tasks which, if delayed, will effect time for overall completion)?
Which activities are non-critical and can run late without delaying project completion time?
What is the probability of the project being completed by a specific date?
At any particular time, is the project on schedule?
At any particular time, is the money spent equal to, less than or greater than the budgeted amount?
Are there enough resources left to complete the project on time?
If the project is to be completed in a shorter time, what is the least cost means to accomplish this and what are the cost consequences?
Critical Path Analysis
The objective of critical path analysis is to determine times for the following:
ES = Earliest Start Time. This is the earliest time an activity can be started, allowing for the fact that all preceding activities have been completed.
LS = Latest Start Time. This is the latest time an activity can be started without delaying the start of following activities which would put the entire project behind schedule.
EF = Earliest Finish Time. The earliest time an activity can be finished.
LF = Latest Finish Time. The latest time that an activity can finish for the project to remain on schedule.
S = Activity Slack Time. The amount of slippage in activity start or duration time which can be tolerated without delaying the project as a whole.
If ES and LS for any activity is known, then one can calculate values for the other three times as follows:
EF = ES + t
LF = LS + t
S = LS - ES or S = LF - EF
Analysis of the project normally involves:
Determining the Critical Path. The critical path is the group of activities in the project that have a slack time of zero. This path of activities is critical because a delay in any activity along it would delay the project as a whole.
Calculating the total project completion time, T. This is done by adding the activity times of those activities on the critical path.
The steps in critical path analysis are as follows:
Determine ES and EF values for all activities in the project: the Forward Pass through the network.
Calculate LS and LF values for all activities by conducting a Backward Pass through the network.
Identify the critical path which will be those activities with zero slack (i.e.: ES=LS and EF=LF).
Calculate total project completion time.
PERT and Activity Time Estimation
The major distinguishing difference between PERT and CPM is the use of three time estimates for each activity in the PERT technique, with CPM using only one time for each activity using CPM.
The three time estimates specified for each activity in PERT are:
the optimistic time;
the most probable time; and
the pessimistic time.
The optimistic, most likely and pessimistic time estimates are used to calculate an expected activity completion time which, because of the skewed nature of the beta distribution, is marginally grater than the most likely time estimate. In addition, the three time estimates can be used to calculate the variance for each activity. The formulae used are as follows:
Where:

o, m, p - optimistic, most likely, and pessimistic times
t - expected completion time for task
v - variance of task completion time
Knowing the details of a project, its network and values for its activity times (t) and their variances (v) a complete PERT analysis can be carried out. This includes the determination of the ES, EF, LS, LF and S for each activity as well as identifying the critical path, the project completion time (T) and the variance (V) for the entire project.
Normally when using PERT, the expected times (t) are calculated first from the three values of activity time estimates, and it is these values of t that are then used exactly as before in CPM. The variance values are calculated for the various activity times and the variance of the total project completion time (i.e. the sum of the activity expected times of those activities on the critical path) is the sum of the variances of the activities lying on that critical path.
Probability Analysis
Once the expected completion time and variance (T and V) have been determined, the probability that a project will be completed by a specific date can be assessed. The assumption is usually made that the distribution of completion dates follows that of a normal distribution curve.
Consider the example where the expected completion time for a project (T) is 20 weeks and the project variance (V) is 100. What is the probability that the project will be finished on or before week 25?
Answer: 0.69
Worked Examples on Networks
A project has the following activities, precedence relationships, and activity durations:
Draw a Gantt chart for the project.
Construct a CPM network for the project.
Identify those activities comprising the critical path.
What is the project's estimated duration?
Construct a table showing for each activity, its activity duration, earliest start time, latest start time, earliest finish time, latest finish time, and the activity slack.
Answers:
C, D
15 weeks
A project designed to refurbish a hospital operating theatre consists of the following activities, with estimated times and precedence relationships shown. Using this information draw a network diagram, determine the expected time and variance for each activity, and estimate the probability of completing the project within sixty days.
An activity has these time estimates: optimistic time o = 15 weeks, most likely time m = 20 weeks, and pessimistic time p = 22 weeks.
calculate the activity's expected time or duration t.
calculate the activity's variance v.
calculate the activity's standard deviation.
A project has the following activities, precedence relationships, and time estimates in weeks:
Calculate the expected time or duration and the variance for each activity.
Construct the network diagram
Tabulate the values of ES,EF,LS,LF and slack for each activity
Identify the critical path, and the project duration.
What is the probability that the project will take longer than 57 weeks to complete?
The project detailed below has the both normal costs and "crash" costs shown. The crash time is the shortest possible activity time given that extra resources are allocated to that activity.
Assuming that the cost per day for shortening each activity is the difference between crash costs and normal costs, divided by the time saved, determine by how much each activity should be shortened so as to complete the project within twenty-six days and at the minimum extra cost.
PROJECT IMPLEMENTATION AND CONTROL
The role of the project manager falls into three areas:
Management of stakeholders
Management of the project life cycle
Management of performance
An approach needs to be developed for each of these. Control and monitoring procedures need to be put in place and appropriate information systems developed.
The procedures which are put into place can only be successful if:
there is satisfactory information to enable the team to manage the project effectively;
they are simple and easy to operate and understand;
they have the full support of the project team.
How should this relate to the three categories referred to above?
i) Management of stakeholders:
Stakeholders' interest must be monitored to ensure that:
their interest and support is maintained;
their views and ideas are being adequately reflected in the project development;
their personal success criteria are being pursued and achieved;
environmental change is fully taken into account.
ii) Management of the project life cycle:
This is probably the most conventional view of project control. Feedback systems need to be set up to monitor key areas.
Activity
For a project that is already underway in your organisation, identify the key areas requiring monitoring and suggest the kind of information and procedures that would be involved.
Suggested Answer
The key areas would be as follows:
The project timetable, with particular reference to critical event times and potential bottlenecks. There should be feedback on activity times achieved and their effect on the whole project. If network analysis is used, then it is vital that the network is reworked and updated to take into account the actual performance achieved.
The project budget; budgetary control procedures can be used as in respect of any other form of budget.
Quality and performance standards; these need to be monitored against the original project specification subject to changes agreed with stakeholders in the course of project development.
Where possible this should all be done through positive reporting which will required action to be taken.
iii) Management of performance:
This is the least tangible but possibly the most important of the three categories. How it is tackled will depend upon what kind of project is being carried out.
It is unlikely that the project team will spend all of their working time together in close proximity and under the direct supervision of the project manager. It is much more likely that they will work apart most of the time, only meeting up occasionally and only meeting with the project manager from time to time. Control issues that need to be considered therefore would be:
How to get the best out of the team when they are together. If you are holding meetings then they should be purposeful and effective. They should not simply be part of the routine. Having said that, they may be an important element in binding the team together and in developing a team approach to planning and monitoring of performance.
Ensuring people work when the team is apart. You need to set people realistic deadlines and ensure that they see the importance of their contribution and that their contribution is fully valued.
Communications are important in terms of disseminating information and keeping everyone informed. There are views that team members should be given information on a need to know basis but this approach can cause problems.
Ensuring continuing commitment by the team and adherence to the values and beliefs being pursued by the team.
Change, in particular, needs to be communicated to team members quickly and effectively.
It is important to stress once again the need to look at the team and also for the project leader to look inwards at his or her own performance.
The most important resource to a project is its people—the project team. Projects require specific expertise at specific moments in the schedule, depending on the milestones being delivered, or the given phase of the project. An organization can host several strategic projects concurrently over the course of a budget year, which means that its employees can be working on more than one project at a time. Alternatively, an employee may be seconded away from his/her role within an organization to become part of a project team because s/he has a particular expertise. Moreover, projects often require talent and resources that can only be acquired via contract work and third party vendors. Procuring and coordinating these human resources, in tandem with managing the time aspect of the project, is critical to overall its overall success.
Planning
When Planning Human Resource Management the first thing is to identify all the project roles and responsibilities. Documenting the reporting relationships and the Staffing management plan are key in the planning process.
Project roles are roles taken up by individuals or groups within or outside of the project it self. The Staffing management plan brainstorms ideas for acquiring team members. It figures out training needs and hiring and releasing information. It holds information about safety and the impact the plan has on the project.
Inputs
To properly define responsibilities and project roles we must look at the inputs involved. Understanding the ways that the existing groups will be involved and how the technical disciplines and individuals interact.
organizational inputs a team must determine what organization groups there are for the project, what role and service they provide and how the groups interact with each other allowing them to complete tasks as one unit. Once all the groups are determined. Then we must look at the Technical side of things and determine what special technologies may need unique ways of integration such as (New computer Software, languages, New Hardware Systems). A team will also have to try and predict any problems that might occur during transition from each life cycle Phase that might greatly hinder and slow down the project. Having tried to predict some of the problems will greatly help the team by allowing them to have an understanding of what things might occur so that they can be ready for them if or when they happen. While the team is looking at what problems might occur they should also look at other areas of the project that might need special attention. This should be done so that if something special is needed to be done to complete a task it’s not a surprise to the team and someone with the abilities needed, can be found and ready to help. Finally we must view the interpersonal relationships and determine the preexisting relationships and communications barriers that could exist as well as the relationship, if any, between supplier and client. Then we should ask some Logistics questions: How much distance is involved between individuals and technologies within the project?(For example a server in a different continent while two team members are based in opposing continents) What kind of transportation may be needed between two parties involved in the project?
In conjunction with these questions about the inputs it is a good idea to have some tangible tools while analyzing all inputs. As experience with project management grows so does certain lessons learned. It is a good idea to stick with things which worked in the past and avoid the things that didn't. By forming Templates and Checklists these things can be easily done and therefore reduce project time greatly. With Templates documentation can be completed much faster and allow for more uniform work. With Checklists projects can keep on schedule, they allow everything to be done and not forgotten allowing the project train to stay on it's tracks.
Tools
Organization Charts and Position Descriptions There are a few different ways to record roles and responsibilities of team members. There are three different ways to document information; hierarchical, matrix, and text-oriented. However the methods are used, the main idea is to make sure each team member knows their roles and responsibilities.
Techniques
Necessary Conditions To Consider
Support
Commitment
Participation
Templates
All projects are different but the majority of projects have similarities. The organizational planning time will move faster if similarities between projects are implemented or using role and responsibility definitions.
Creating a template for the entire project to make sure staff don’t start drifting out of scope can also be a good idea. This template (depending on your project) most likely will not be functioning, more or less just a visual representation of the work to be completed. Once a visual representation is set up people will know in what order tasks need to complete.
Project Roster
Proper planning will have you determining the required skills to place employees in the proper areas to work most efficiently. This could include hiring new staff or transferring employees from certain sections. A great idea on determining placement for employees is creating a project Roster. A roster will help you outline the roles and responsibilities for each staff member, by the projects scope, and work to be completed. In developing the roster, eventually it will identify how many members should be designated to which section, or where to fill in the gaps so to speak.
Project Support Team
Setting up a project support team is something to consider. It does require additional funding and staff; however stalls or problems in the project may be completed faster if veteran project managers or IT professionals are on call.
Hiring a Consultant
Hiring a consultant could be a good way for you to get the ball rolling for a major project. Some one with experience motivating people and following through with large scale projects would definitely be an asset to the work at hand.
Human Resource Practices
There are many policies, guidelines, or procedures that a business or organization might have that can greatly speed up organizational planning. A project management team can use these to better understand the roles of specific management or how other processes in the organization work.
Organizational Theory
Needs to be understood by all team members so that they can quickly respond to the requirements of a project by having the general knowledge of the way teams, departments and people perform.
Costs
Keeping track of costs and budgeting can be a small problem. A Good option is to make an excel spread sheet or some other type of basic budget to abide by for the initial process of the project. This way other spending can be outlined to speed up the process or set funding where it would be better used.


No comments:
Post a Comment